Visual early warning control platform (LAN operation and maintenance system) FT-CNS-OPS

  • Provides comprehensive system management, including node monitoring, fault detection, and log operations using C/S architecture.
  • Supports network topology visualization, statistical reporting, and alarm management for real-time system monitoring and troubleshooting.
  • Allows multiple users to access the platform, with customizable UI and detailed operational logs for easier management.
Description
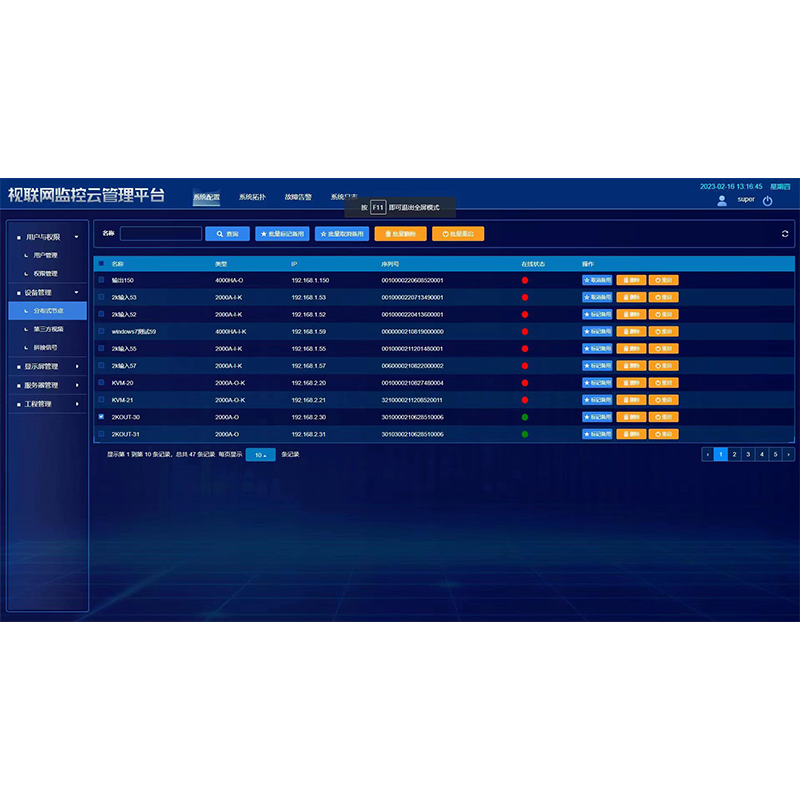
  • System management: Using C/S architecture, the node status of the entire project can be monitored, including operating status, temperature, faults, log operations, etc.
  • System operation and maintenance: Identify different product models and display network parameters to facilitate node management
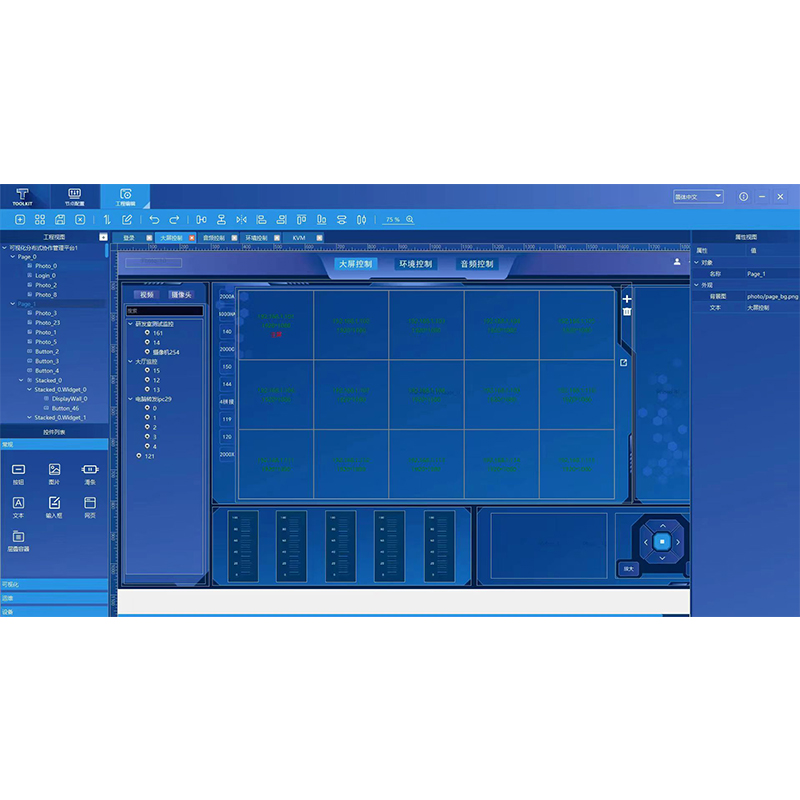
  • Network topology diagram: Engineering personnel edit the system topology diagram according to the wiring conditions of the project site, and easily view the operation status of all nodes through the operation and maintenance system. When a node fails, the corresponding node in the system topology will change color to warn
  • Device view, using a tabular and graphical interface to display the status of all nodes in detail and intuitively, such as: device temperature, IO status, memory usage, network status, etc.
  • Supports displaying the status of each node in the form of a chart, and can perform batch classification and display management of nodes
  • Statistical report: Use the big data platform to display the statistical data of the distributed system. Including but not limited to device classification statistics, device area statistics, online peak statistics, fault statistics, etc. Rate statistics, alarm rate statistics, etc., you can directly view the total number of access nodes, online devices, faulty devices and device online time statistics
  • Support multiple users to log in to the early warning control platform to monitor nodes
  • Automatic alarm: Centrally display the alarm information and operation log information of all devices, and theoretically support unlimited information storage. Alarm information includes overtemperature, network disconnection, abnormal video status, etc. Users can process a certain alarm. After processing, the system will record the processing personnel and processing time for easy management, and support log export in excel format
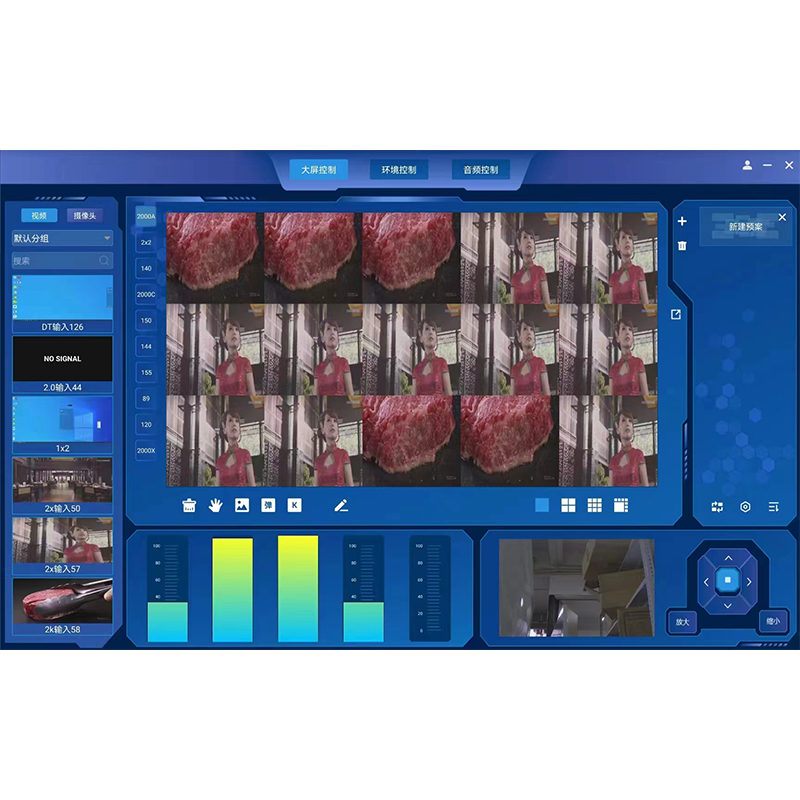
  • Operation log: The operation log includes most operations such as kvm login, logout, adding scenes, deleting scenes, etc. Each log will generate operator and operation time records, so that the use of the entire distributed system is in a monitorable and manageable state. Support log export in excel format 10. Software interface: Users can customize the UI interface according to requirements and design it by dragging and dropping
Parameter
Donwload
Get Quote

Your email address will notbe published, Required fields are marked

Product Related

Distributed visual management and control platform (software) FT-Magic

control Panel FT-DSP-T4C

control Panel FT-DSP-E1